Adding a Data Visual Widget to a Dashboard
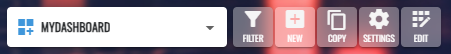
To add a new widget to a dashboard, the dashboard must first be put into Edit mode by clicking the Edit button in the main menu bar (see below).
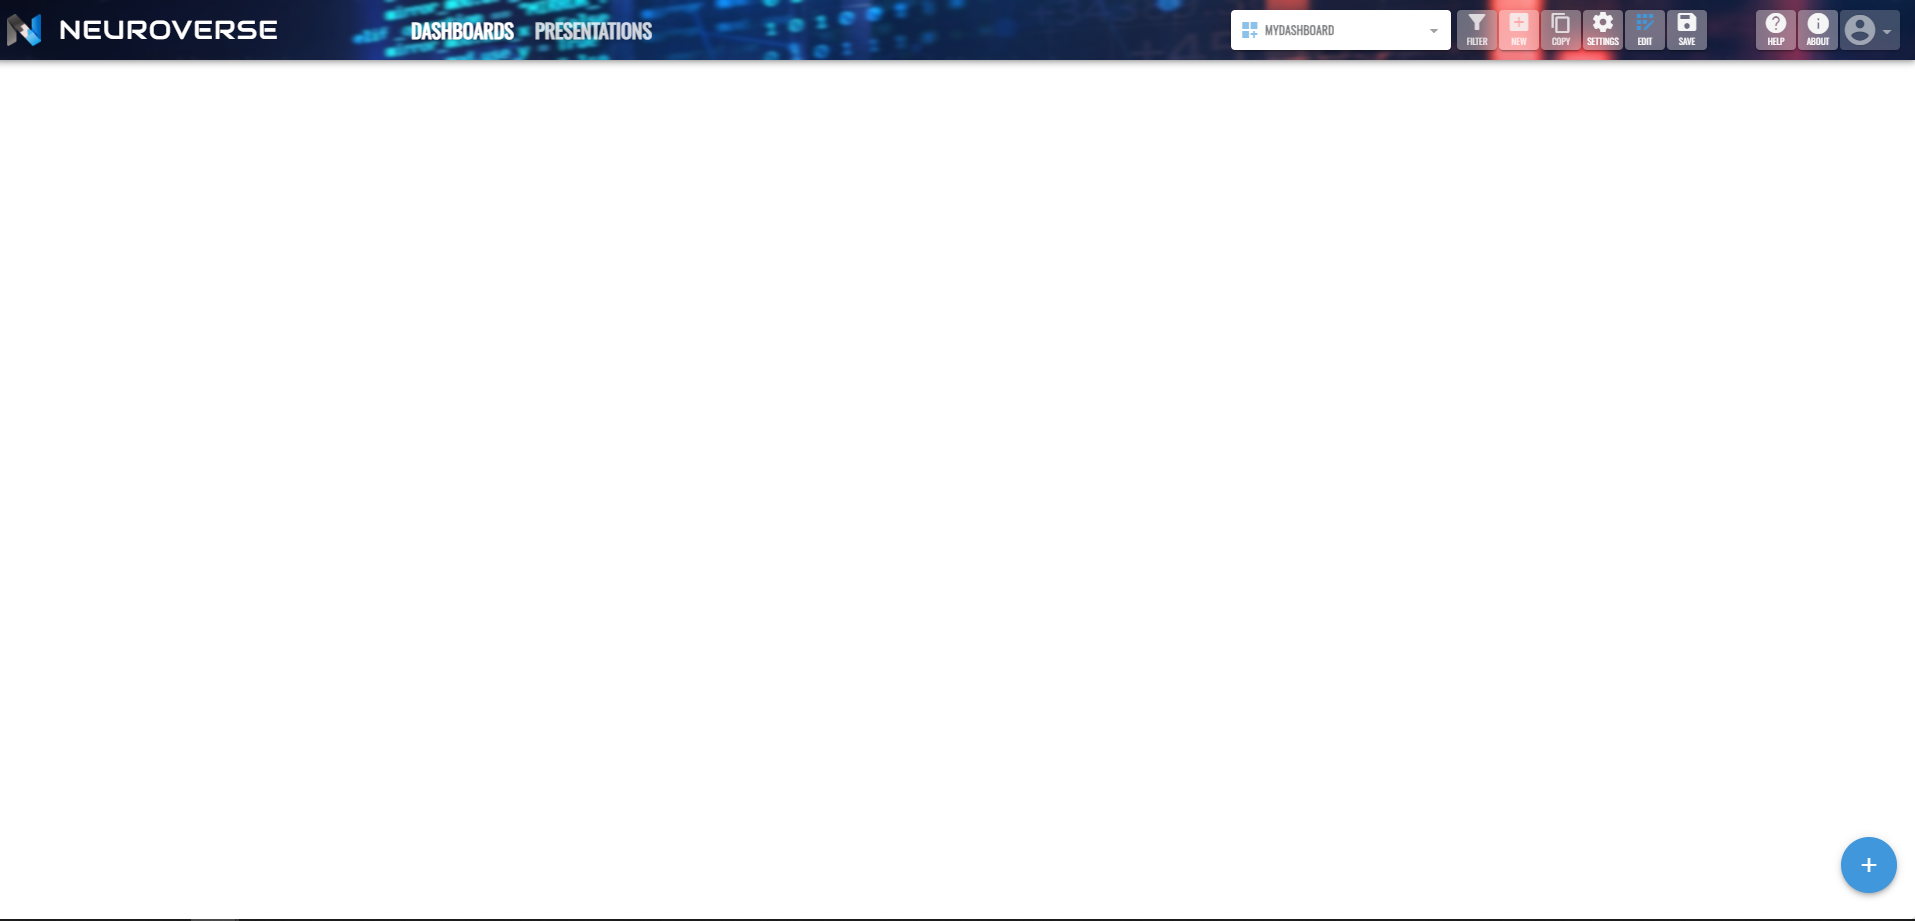
When a dashboard is in Edit mode additional buttons will appear at the right of the Edit button, and the Add Widget fab button will appear at the bottom right of the dashboard as shown below.
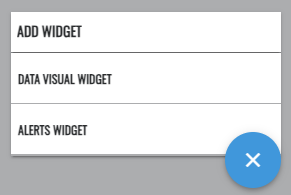
Click the Add Widget fab button, then click the Data Visual widget option that appears on the fab button menu shown below.
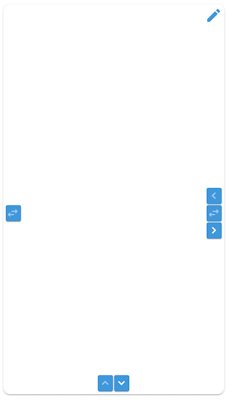
A new empty Data Visual widget will now be displayed in the first position of the dashboard as shown below.

Hovering over the new widget will display the edit icon button at the top right of the widget as shown below.
Clicking the edit icon button will display the edit popup for the widget.

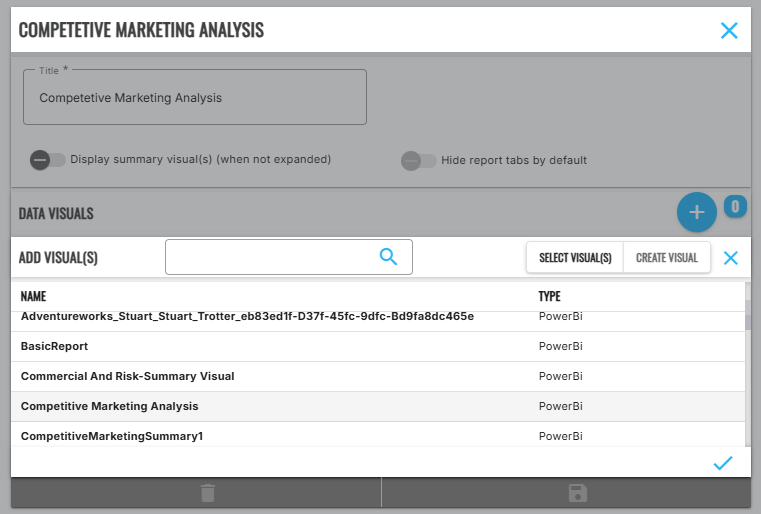
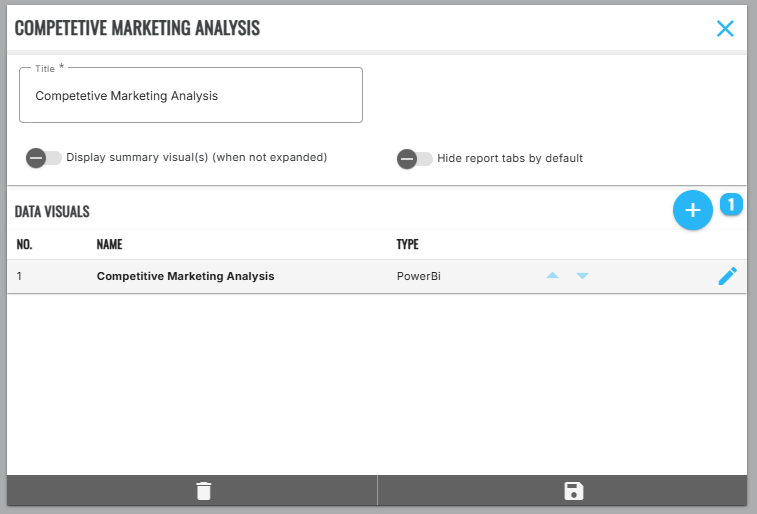
On the edit popup select the Add button at the top right of the Data Visuals section, select a visual from the list displayed (in this case a Power BI visual), set the desired Title for the widget and click the Save button as shown in the screenshots below.
The specified visual will now appear in the body of the widget as shown below.
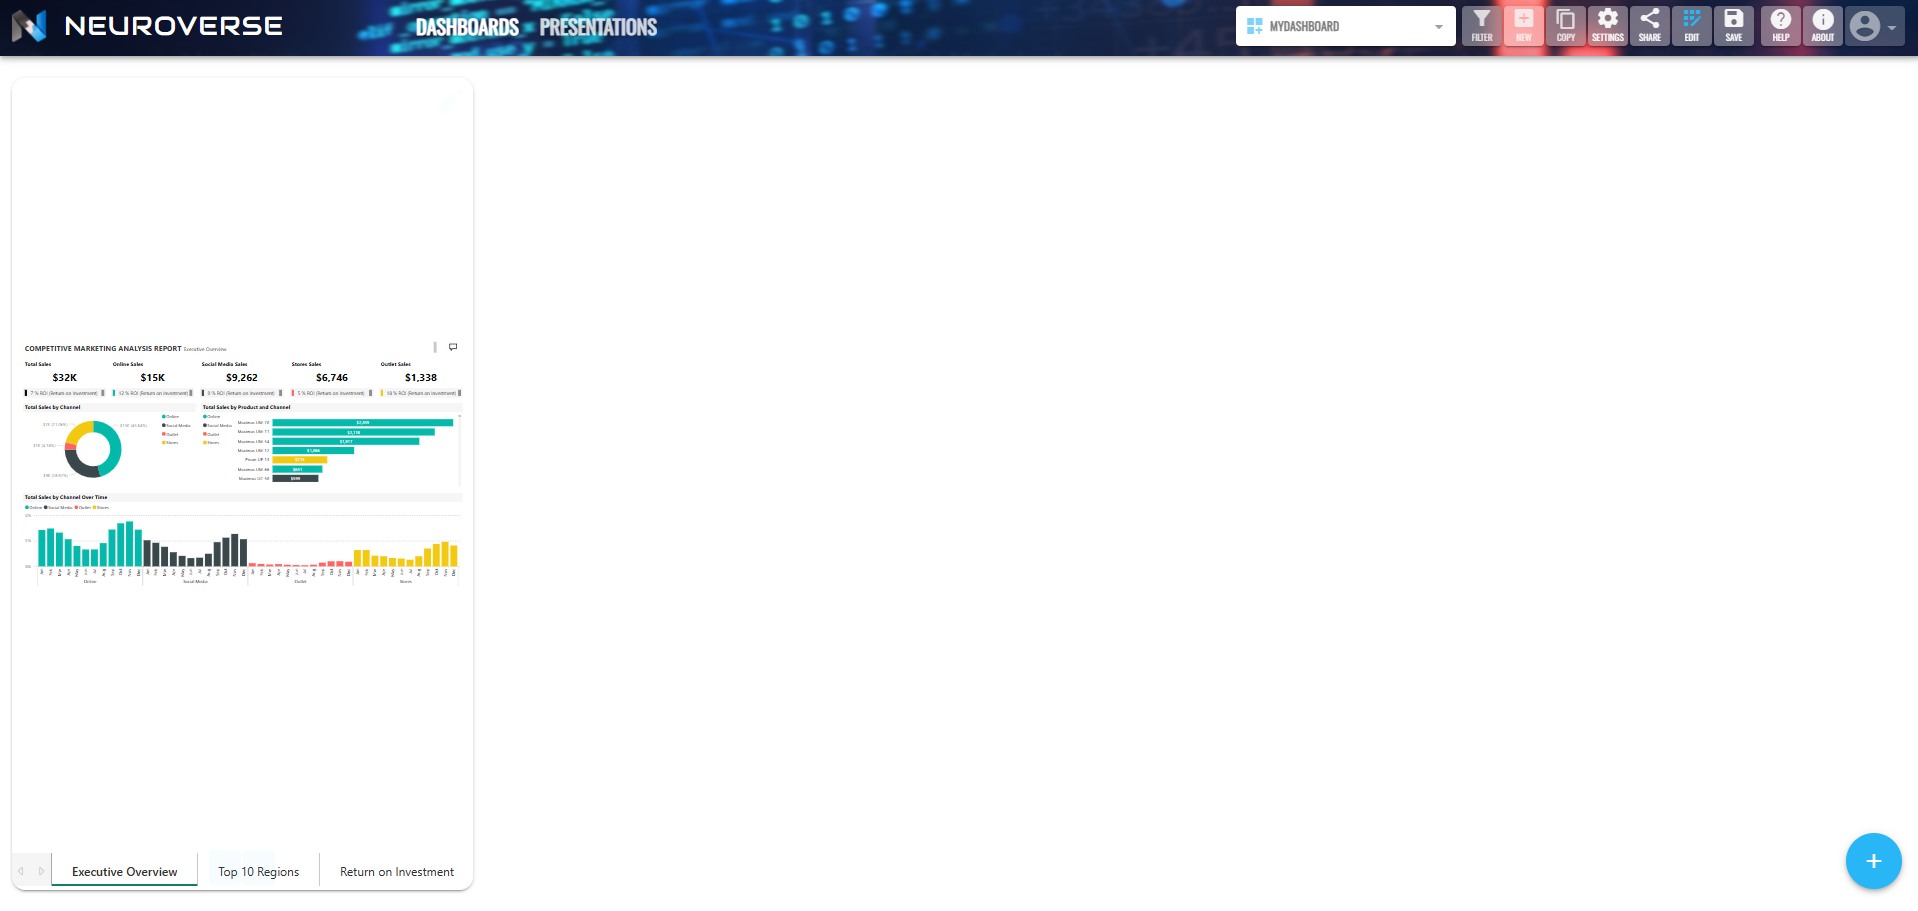
It is important to save the changes you have made to your dashboard by clicking the Save button in the main menu bar section at the top of the screen.