Displaying More Than One Visual on a Data Visual Widget
You are able to display more than 1 visual on a Data Visual widget.
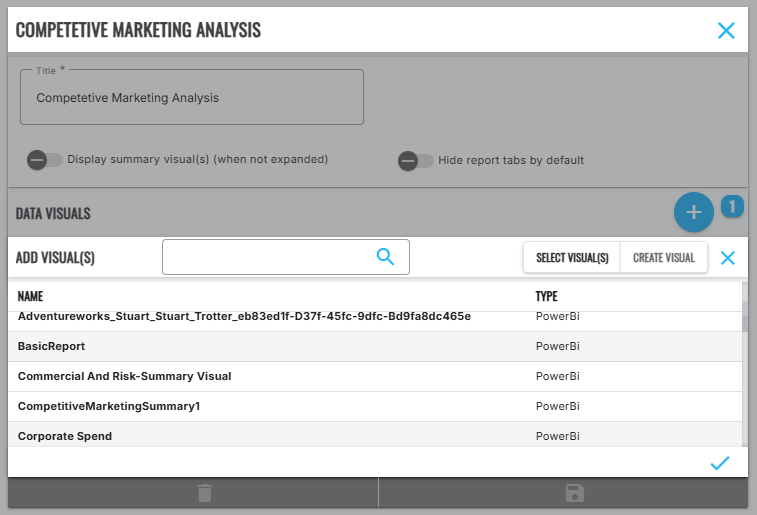
To do this display the edit popup for a Data Visual widget by first hovering over the widget, then selecting the edit icon button at the top right of the widget. Then select the Add button in the Data Visuals section. Select one or more additional visuals from the list, then select the check button to confirm as shown below.
All specified visuals will now be shown in the Data Visuals data table on the edit popup as shown.
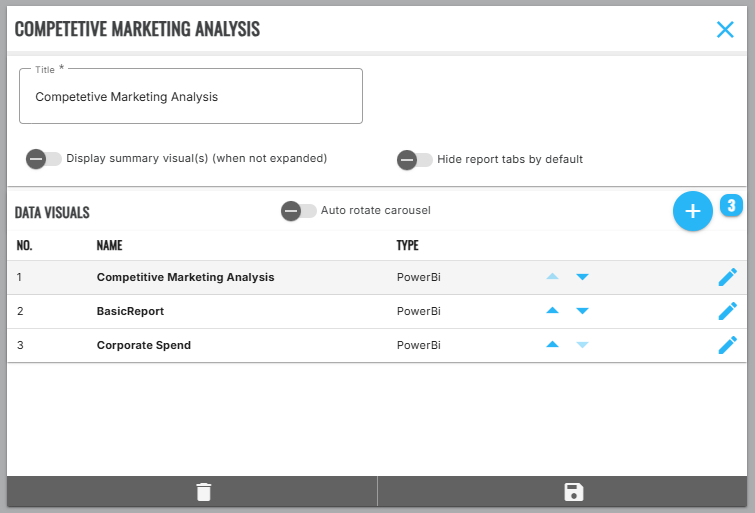
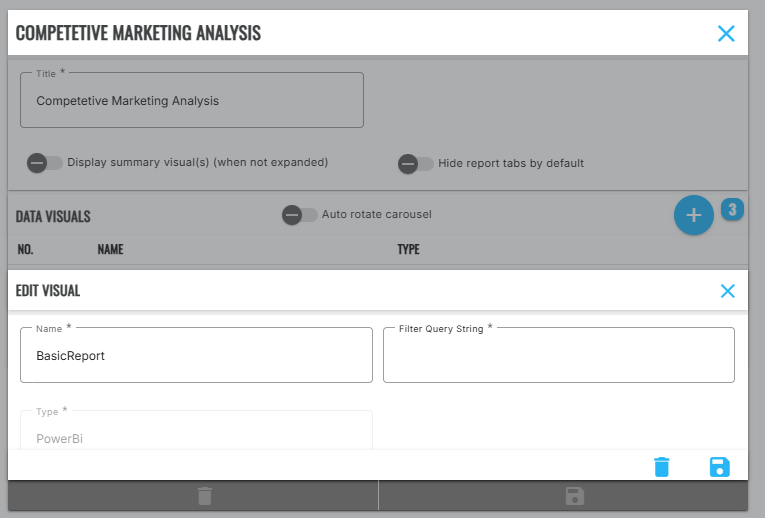
You are able to change the order of the visuals by selecting the up and down arrow buttons at the right of the data table. A visual can be removed from the widget altogether by selecting the edit icon button, then clicking the Delete button from the resultant Edit Visual bottomsheet that appears on the popup (see below).
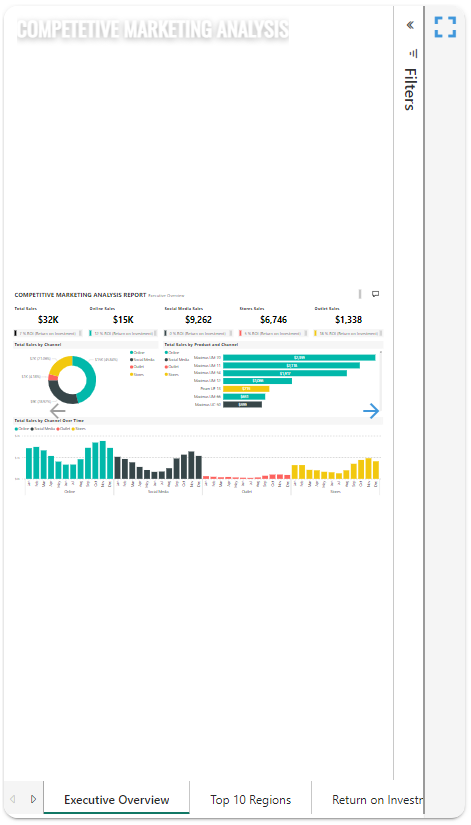
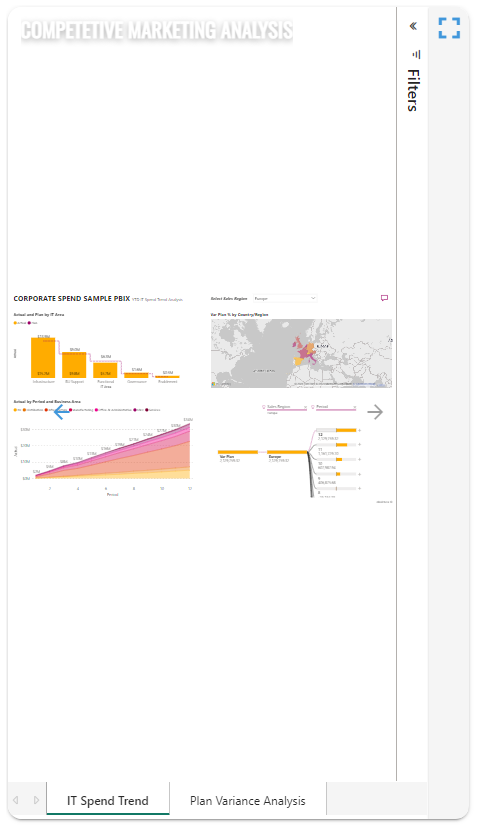
The different visuals for a widget can be viewed by hovering over the widget, then clicking the left and right arrow buttons for the widget as shown below.
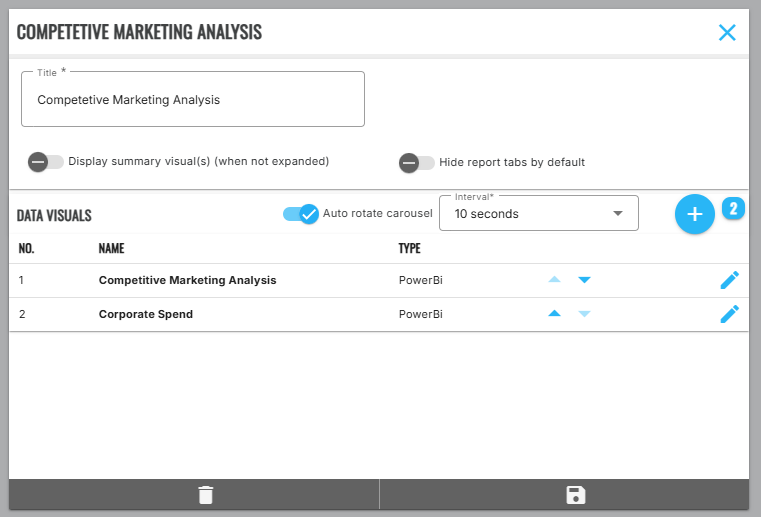
Auto Rotating Display of Multiple Visuals for a Widget
In order for the visuals for a widget to automatically have their display rotated, turn the Auto rotate carousel toggle switch on and specify the desired rotation interval as shown below.